
For developers · Market data

Crypto Bubbles API: where the data really comes from and how to build your own board

Short answer to the most common question: the official app does not advertise a public API. The longer answer is more interesting — because the entire data supply chain that bubble apps rely on is publicly available, and you can build your own board out of it in one evening. Here's how: picking a source, REST versus WebSocket, and the code that draws the bubbles.

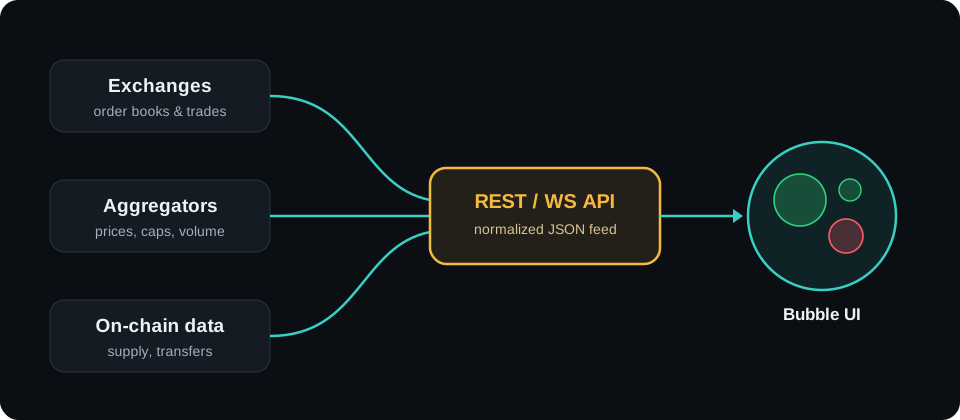
Data flow diagram: crypto exchanges, aggregators, API and the bubble interface

Straight answer

Does Crypto Bubbles have a public API?

Let's start with what most people came here for. The official cryptobubbles.net site does not advertise a public, documented developer API. There's no developer portal, no request pricing, no endpoint documentation. Crypto Bubbles is a consumer product — a visualization covering more than a thousand coins, refreshed automatically, available in the browser and in mobile apps (that's how its own site presents it) — not a data warehouse.

We say that plainly because the web is full of tutorials implying otherwise, or worse, of pages posing as "the official Crypto Bubbles API" with keys for sale. Treat those the way you'd treat a sideloaded APK from a forum: somebody is trying to sell you something the maker doesn't offer. The rule from our app download guide applies here too — the only source of truth about the official product is cryptobubbles.net.

And now the good news: you don't need any particular app's API to build your own bubble board. Bubbles are just a way of drawing data the market publishes anyway. You need four numbers per coin and about forty lines of code. The rest of this page is about exactly that.

How bubble apps get their data: a three-link chain

Every market visualization — from bubbles to the heatmaps we cover in the market map guide — sits on the same supply chain:

  • Link 1: exchanges. The original source of every price is a specific exchange's order book. That's where trades actually happen, and "the price of bitcoin" is in reality dozens of prices from dozens of venues, differing by fractions of a percent.
  • Link 2: aggregators. Data services collect quotes from hundreds of exchanges, average them (usually volume-weighted), add circulating supply, and publish finished metrics: market cap, rank, percentage changes over standard time windows.
  • Link 3: applications. Visualizations like a bubble board pull normalized JSON from aggregators and convert numbers into geometry and color. All the "magic" happens in the user's browser.

That split has a practical consequence for your project: you can tap in at any link. An aggregator gives you convenience — one endpoint, thousands of coins, market caps already computed. An exchange gives you freshness — data straight from the book, no intermediary and no averaging lag, but only for pairs listed on that one venue. Mature projects often combine both: the aggregator for ranking and market cap, the exchange for real-time prices.

Architecture

REST or WebSocket: two ways to drink from the same tap

Every serious market data API serves its numbers two ways, and choosing between them is your project's first architectural decision.

REST works like question and answer: you send an HTTP request, you get JSON, conversation over. Upsides: simplicity, easy debugging (you can eyeball the response in a browser), free caching. Downsides: every update is a new request, and rate limits on free tiers can be tight — typically a few to a few dozen requests per minute. For a bubble board refreshed every 30–60 seconds that's plenty; incidentally, the official Crypto Bubbles app also refreshes its data every few dozen seconds, according to its own site.

WebSocket is an open line: you establish one connection and the server pushes every change to you — a new price tick, a new trade, an order book update. Upsides: latency in milliseconds instead of seconds, and no wasting your quota on asking "has anything changed?" Downsides: you have to handle dropped connections, resubscription, message queuing — the code gets serious. WebSocket is mandatory for algorithmic trading and live tickers; for visualizing the "state of the market" it's often a cannon aimed at a sparrow.

Practical rule: start with REST. Move to WebSocket only when you can articulate exactly what a 30-second delay breaks for you. If you can't, it breaks nothing.

The four fields that draw a bubble

Let's take the board apart into data. To render a sensible bubble view you need exactly four fields per coin:

  • Symbol (BTC, ETH…) — the bubble's label.
  • Market capitalization — drives size. It, not unit price, expresses a project's scale; why that difference is fundamental is explained alongside the CoinCompare calculator.
  • Percentage change over the selected window (hour, day, week…) — drives color and its saturation.
  • 24h volume — draws nothing directly, but lets you filter out "dead" coins whose price moves on three trades a day.

Everything beyond that set — rank, supply, all-time high, links — belongs to the coin card, not to the board itself. Note that we're talking about a few hundred bytes per coin: a thousand coins is one JSON response the size of a small photo. That's why bubble boards run smoothly even on weak phones.

Normalizing data: the boring part that decides whether your board is honest

Between "I have JSON" and "I have a board" sits a layer everyone underestimates. Three things reliably bite. First, ticker collisions: several unrelated tokens share a symbol, so key your data on the aggregator's internal id, never on the ticker string. Second, missing market caps: for tokens with unverified supply, aggregators frequently return null, and a null radius produces either a crash or an invisible bubble — decide explicitly whether you skip those coins or show them at minimum size. Third, percentage-change windows are not standardized: one provider's "24h" is a rolling window, another's is measured from midnight UTC. Mixing them silently makes your board lie in a way nobody will ever report as a bug.

Workshop

Mini tutorial: your own bubble board in one evening

Below is a JavaScript skeleton — deliberately simplified pseudocode, to be completed with your chosen API's address. The logic has three stages: fetch tickers, turn market cap into a radius and percentage change into a color, then draw.

// 1. Fetch the data (REST, refresh every 60 s)
async function fetchCoins() {
  const res = await fetch(API_URL + '/tickers?limit=100'); // API key in the header, never in the code
  const coins = await res.json();
  return coins.filter(c => c.volume24h > 1_000_000); // cut out the dead coins
}

// 2. Scaling: radius ~ square root of market cap
//    (the eye compares the AREA of circles, not the radius!)
function radius(cap, maxCap) {
  const R_MAX = 90, R_MIN = 6;
  return Math.max(R_MIN, R_MAX * Math.sqrt(cap / maxCap));
}

// 3. Color: green for gains, red for losses,
//    saturation grows with the absolute change
function color(changePct) {
  const sat = Math.min(Math.abs(changePct) / 15, 1); // full saturation from ±15%
  return changePct >= 0
    ? `rgba(34, 197, 94, ${0.35 + 0.65 * sat})`
    : `rgba(239, 68, 68, ${0.35 + 0.65 * sat})`;
}

// 4. Drawing: canvas + a simple repulsion simulation
setInterval(async () => {
  const coins = await fetchCoins();
  const maxCap = Math.max(...coins.map(c => c.marketCap));
  draw(coins.map(c => ({
    label: c.symbol,
    r: radius(c.marketCap, maxCap),
    fill: color(c.change24h)
  })));
}, 60_000);

Two notes that go beyond the skeleton. First, layout physics: to stop bubbles overlapping, use an off-the-shelf force simulation — in d3 that's the d3-force module with collisions (forceCollide); on raw canvas a loop that pushes intersecting circles apart is enough. Second, the square root in the radius function is not a stylistic choice: the area of a circle grows with the square of the radius, so scaling the radius linearly would make a coin 100 times larger occupy 10,000 times more screen. Half the amateur boards on the web make exactly this mistake and visually lie about market proportions — and proportions are the entire point of this visualization, as we discuss at length in the guide to what Crypto Bubbles is.

A third note for whoever ships this to real users: cap the work, not just the data. A thousand animated circles at 60 frames per second will melt a mid-range phone if every frame recomputes collisions from scratch. The usual fixes are unglamorous and effective — run the force simulation at 20 ticks per second while drawing at 60, freeze the simulation once positions stop moving, and stop the loop entirely when the tab is hidden via the Page Visibility API. Users notice battery drain long before they notice your color scale.

Choosing a data API: six criteria

CriterionWhat to askWhat to watch for
Market coverageHow many coins and exchanges? Does it compute market caps?"10,000 coins" is often counted with dead, zero-volume tokens
WebSocketIs there a live stream, and of what (ticks, trades, order book)?Some providers gate WS behind the first paid tier
Rate limitsHow many requests per minute/month on your plan?Limits counted per endpoint can surprise you mid-month
PriceCost of the plan at your realistic traffic, not today'sJumps between tiers are frequently several-fold
Historical dataHow far back do candles go, and at what resolution?Free tiers often give days, not years
Stability and SLAStatus page, incident history, uptime guaranteesNo public status page is an answer in itself

A separate word about exchange APIs as a first-class source: if your project touches trading — backtesting, a bot, monitoring your own orders — an exchange API isn't an alternative so much as a requirement, because only it gives you the order book, trade history and the ability to place orders. Documentation from mature exchanges offers REST and WebSocket, sandboxes for testing, and client libraries in the popular languages. It's also the shortest route from the theory on this page to a real data stream.

Information about the official Crypto Bubbles app's features (coin coverage, platforms, refresh frequency) is attributed to cryptobubbles.net (as of July 2026).

Caching and rate-limit hygiene

The fastest way to get throttled is to treat an API like a local database. Three habits keep you well inside any free tier. Fetch once, fan out many: if your page has three widgets that need ticker data, fetch it once into a shared store rather than three times. Put a cache between you and the provider: even a 30-second in-memory cache on your own tiny backend collapses a hundred visitors into one upstream request — and it means your board keeps rendering when the provider has an outage. Back off on errors: when you get a 429 or a 5xx, retry with exponential backoff and jitter, never in a tight loop. A retry storm from your own client looks exactly like an attack from the provider's side, and gets treated as one.

Security

API keys: a short course in not burning down your own account

This section is written from the position of an auditor who has seen far too many repositories with keys in their commit history. An API key for public data is a trifle — worst case somebody eats your request quota. An API key for an exchange account is an entirely different category: in the wrong hands it can empty the account. The rules:

  • Never commit keys. Keep them in environment variables or a secrets manager; put .env in .gitignore on day one. A key that has ever landed in repository history should be considered burned — generate a new one, because deleting the file does not delete it from history.
  • Minimum permissions. Reading data needs nothing more than a read-only key. Grant trading rights only to bots that actually trade, and withdrawal rights preferably never. No analytics bot needs the ability to move funds out.
  • IP allowlists. Mature APIs let you pin a key to specific addresses. A leaked key bound to your server's IP is useless to a thief.
  • Rotation and hygiene. A separate key per project, a quarterly review that deletes unused ones, immediate rotation on any suspicion of a leak. It sounds bureaucratic, takes ten minutes, and saves accounts.
  • Keys belong on a server, not in a browser. Anything shipped to the client is public, including a key hidden in a bundled JavaScript file. If your board needs an authenticated endpoint, proxy it through your own small backend and let the browser talk only to you.

Warning: bots and "signal tools" that ask for a key with withdrawal rights are a standard theft vector. A legitimate analytics tool never needs those permissions — the request itself ends the conversation.

The short version of this page

  • The official Crypto Bubbles app does not advertise a public API — steer well clear of anyone selling "official keys."
  • Data flows along a chain of exchanges → aggregators → applications; your own project can tap in at any link.
  • REST is enough for a board refreshed once a minute; take WebSocket only when latency genuinely hurts.
  • Drawing bubbles needs symbol, market cap, percentage change and volume — plus a radius scaled by square root.
  • API keys: out of the repository, minimum permissions, pinned to an IP, rotated.

FAQ

Frequently asked questions about the Crypto Bubbles API and market data

Does Crypto Bubbles offer a public API?

The official cryptobubbles.net site does not advertise a public, documented developer API — the app is a consumer product, not a data vendor. If you want to build your own visualization, use the APIs of market data aggregators or go straight to exchange APIs.

REST or WebSocket — which should I use for market data?

REST for anything you refresh every few dozen seconds (market caps, rankings, percentage changes) — it is simpler and far easier to debug. WebSocket for a live stream of trades and price ticks, when every second counts. A bubble board runs perfectly well on REST.

Which data fields do I need to draw bubbles?

The minimum is four fields per coin: symbol, market capitalization, percentage change over your chosen window, and volume. Market cap drives the bubble radius, percentage change drives the color, and volume is useful for filtering out dead coins.

Why does a bubble's radius scale with the square root of market cap?

Because the eye compares the areas of circles, not their radii. Area grows with the square of the radius, so for a coin ten times larger to occupy ten times more area, the radius has to grow like the square root of market cap. Scaling radius linearly would visually inflate large coins by hundreds of times.

Is a free market data API enough for a personal project?

For learning and a hobby dashboard, usually yes: free aggregator tiers offer anywhere from a few to a few dozen requests per minute, and a board refreshed every 30–60 seconds fits inside those limits. A commercial product needs a paid plan with an SLA, higher limits and historical data.

How do I store API keys safely?

Never in code and never in a repository — only in environment variables or a secrets manager. Give keys the minimum permissions they need (read-only, no withdrawal rights), turn on an IP allowlist, and rotate them the moment you suspect a leak. Treat a key with trading rights like your online banking password.

From reading docs to your first request

The fastest way to learn market data APIs is to send real requests. Exchange API documentation with REST, WebSockets and permission-scoped keys is a good place to start.