
Tools ยท Comparison calculator

CoinCompare calculator: what if DOGE had Bitcoin's market cap?

One division sum that disarms half of crypto marketing. A market cap comparison calculator shows what coin A would cost at coin B's valuation โ€” and in the process it mercilessly exposes how absurd most "cheap coin, easy 1000x" promises are. Here's the formula, the worked numbers, and the places where this tool is genuinely useful.

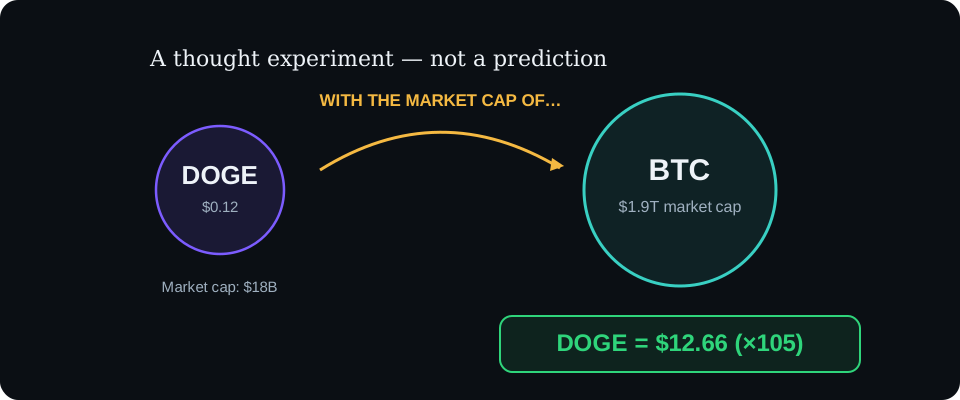
CoinCompare calculator diagram: the DOGE bubble rescaled to Bitcoin's market capitalization

Basics

What a market cap comparison calculator actually computes

A CoinCompare-style calculator answers one very specific question: what would a single unit of coin A cost if the entire project A were worth as much as project B? It doesn't predict the future, doesn't read charts, doesn't look at tokenomics. It takes two public numbers โ€” the target coin's market capitalization and the base coin's circulating supply โ€” and performs one division.

Sounds trivial? It is trivial. And yet that one division can dismantle, in about ten seconds, a narrative that thousands of people have spent real money on. When somebody promises that a half-cent coin is "going to a dollar because it's cheap," the calculator immediately shows what market cap would have to sit behind that. Usually the number is big enough that even the person making the promise starts to stammer.

In the ecosystem of tools around bubble-style market views, a comparison calculator plays a complementary role. The bubble board shows market cap proportions visually โ€” a big bubble means a big valuation, which we unpack in the bubble chart guide โ€” and the calculator converts those proportions into a concrete hypothetical price. Both exist for the same purpose: to see the market's scale as it actually is, not as marketing paints it.

The formula worth memorizing

All the math fits on one line:

Hypothetical price of A = market cap of B รท circulating supply of A

An example on round, illustrative numbers (every figure in this article is illustrative โ€” real caps and supplies move daily, so check them live in a data aggregator): assume Bitcoin has a market cap of $1.2 trillion and Dogecoin has roughly 145 billion coins in circulation. If DOGE took over BTC's capitalization, one coin would be worth 1,200,000,000,000 รท 145,000,000,000 โ‰ˆ $8.28. Not $100. Not $50. Eight dollars and change. At a current price somewhere in the mid-teens of cents, that's a multiple of roughly 50x. A lot? Enormous. But the framing "DOGE worth as much as all of Bitcoin" already tells you how heroic the assumption is.

Second example, from a different shelf entirely: a small project with an $80 million market cap and 400 million tokens outstanding (price: $0.20). What if it grew into Ethereum's capitalization โ€” say $400 billion? Do the sum: 400,000,000,000 รท 400,000,000 = $1,000 per token, a 5,000x. And here the calculator does its best work: a 5,000x means the market would have to pump hundreds of billions of dollars of fresh capital into this one project. How many projects in crypto history have managed that? Exactly one. It's called Ethereum.

Third example, and the most useful kind, because it stays inside one league: a layer-2 token with a $600 million cap versus the sector leader at $9 billion. That's a 15x if it fully dethrones the leader โ€” and roughly a 3x if it captures a fifth of the leader's valuation. Notice how different this conversation feels. Nobody has to believe in a miracle; you're arguing about market share inside a category, which is an argument you can actually research. That's what a comparison looks like when it isn't being used as a sales pitch.
The devil in the details

Circulating, total and max supply โ€” why this changes everything

The most common way people break this simple division is plugging in the wrong supply. Crypto uses three different numbers, and each tells a different story:

  • Circulating supply โ€” tokens genuinely out in the market and available to trade. This is what market cap is computed from, and it's what belongs in the formula when you're asking about a price "right now."
  • Total supply โ€” every token issued, including whatever is locked with the team, sitting in a project treasury, or working through a vesting schedule. This number tells you how much supply is still coming.
  • Max supply โ€” the hard ceiling on issuance, if one exists. Bitcoin has 21 million and that's it; plenty of tokens have no cap at all, which is itself a piece of information.

Why does it matter so much? Picture a token with 100 million in circulation and a total supply of 1 billion โ€” 90% of the tokens are waiting in an unlock schedule. Run the calculator on circulating supply and you get a hypothetical price ten times higher than the same calculation after full unlock. An influencer will show you the first number. An honest analyst shows you both. The valuation that accounts for full future supply even has a name: FDV (fully diluted valuation), and comparing FDV against current market cap is one of the fastest integrity tests you can run on a token's design.

Warning: if the gap between circulating and total supply is a multiple rather than a margin, treat every calculator output as a price written on water. Incoming supply is gravity โ€” it always acts, just with a delay.

Where to get supply data (and why from two places)

Market aggregators report circulating supply according to their own methodologies, and they sometimes disagree โ€” especially for projects that report foundation tokens "creatively." Before you build any comparison that a decision will rest on, check the supply in at least two independent sources. A 1โ€“2% divergence is normal methodological noise; a 30% divergence is a red flag and an invitation to read the project's docs. How aggregators collect and normalize this data on the technical side is covered in our guide to APIs and market data.

Dark crypto portfolio tracker interface showing market cap statistics and price changes
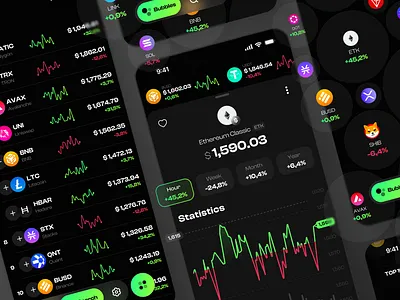
Market cap, supply and price change โ€” the three numbers a comparison calculator lives on.

Psychology

Unit bias, or why "cheap coin" is the most expensive myth in crypto

Let's talk like friends for a minute, because this is a myth that costs people actual money. Unit bias is our brain's habit of thinking in whole units: we'd rather own 10,000 coins at a cent than 0.0001 bitcoin, even though those are the same amount of money. A $0.10 coin feels cheap, because we mentally compare it with a $100 coin โ€” the way we compare prices at a grocery store.

The problem is that a crypto asset's unit price is a nearly arbitrary number. It depends on how many units the creator chose to issue, and that's a purely cosmetic decision. A project can have a trillion tokens at $0.001 or a million tokens at $1,000 and be worth exactly the same. Saying "this coin is cheap because it costs a fraction of a cent" makes as much sense as saying "this pizza is bigger because it was cut into sixteen slices instead of eight."

So the fantasy "a $0.10 coin will go to $100, it's only a hundred bucks, Bitcoin costs way more!" breaks against arithmetic. Going from $0.10 to $100 is a 1,000x increase in market cap. If the project was worth $200 million, it would have to reach $200 billion โ€” jumping into the absolute top tier of the entire market, next to projects built over a decade. A CoinCompare calculator performs exactly that translation, which makes it the best available vaccine against unit bias: it turns "it's only a hundred dollars" into "this project would have to be worth half a Bitcoin." Feel the difference? That's the point.

Here's a small habit that kills unit bias permanently: stop quoting coins in dollars per unit and start quoting them in market cap. Instead of "SHIB at $0.00002," say "a $12 billion project." Instead of "ETH at $3,400," say "a $400 billion project." Do it for two weeks and the whole cheap-versus-expensive framing stops being available to your brain. You'll also find that a lot of pitches simply stop working on you, which is the real return on the exercise.

What the calculator is genuinely for

Strip away the fantasies and you're left with entirely legitimate, useful applications:

  • A sobriety test for narratives. Somebody says "X is the next Ethereum"? Plug in ETH's cap and see what multiple falls out. If it's 800x, you now know you're discussing a lottery ticket, not an investment thesis.
  • Sizing a scenario's ceiling. Instead of asking "how much can this go up?", ask "what market cap would it need to go up N times โ€” and does anybody in this sector have that cap?" It's a much healthier frame for thinking about upside.
  • Comparing within a sector. Putting an exchange token next to the leading exchange token, or a DeFi protocol next to the largest DeFi protocol, tells you far more than comparing anything to Bitcoin. The sector view of the market is easiest to eyeball in the bubble market map.
  • Pricing dilution. Run it once on circulating supply and once on total supply, and you see how much of the promised upside future emissions will eat.
  • Reality-checking your own portfolio. Sum the caps your holdings would need for your personal price targets to be true. People are frequently startled to discover their portfolio's implied scenario requires a crypto market several times the size of today's.

How the same tool gets used to fry people's brains

Honesty requires saying this too: market cap comparisons are the favorite hammer of crypto influencers. The pattern never varies. Take a microscopic project, plug in a giant's capitalization, present the output as "potential": "if COIN reached just 10% of Solana's market cap, that's already 40x โ€” and 10% is conservative!" No, it is not conservative. "Just 10% of the sector leader's cap" is, for the overwhelming majority of projects, a career-best outcome achieved by single-digit percentages of everything that launches. The word "if" is doing all the work in that sentence, and the listener only remembers the number.

Warning signs that somebody is aiming a calculator at you: comparisons that only ever run one direction (never "what if it fell to the cap of project X, which died"), no mention of supply or unlocks, multiples thrown out with no sector context, and โ€” the classic โ€” comparing unit prices instead of capitalizations. When you see that, close the video and run the numbers yourself. The formula is above; it takes thirty seconds.

One more tell worth naming: the missing denominator. A pitch that mentions the target market cap but never the base coin's supply is not an analysis, it's a slogan with a decimal point. Ask for the supply figure and watch how often the conversation changes subject.

Tip: invert the calculator. Instead of "what if it grows to B's market cap," compute "what if it falls to C's market cap." The downside scenario uses the identical formula, and it is considerably more useful to your portfolio.

Running the downside, with numbers

Let's do the inverted version properly, since almost nobody does. Take that same illustrative small project: $80 million cap, 400 million tokens, $0.20 per token. Now ask the unpopular question โ€” what if it drifts down to the capitalization of a comparable project that lost its narrative and settled at $8 million? The math: 8,000,000 รท 400,000,000 = $0.02. That's a 90% drawdown, and it is not an exotic scenario in crypto; it's the modal outcome for tokens whose story goes quiet. Suddenly the honest sentence about this position is "the arithmetic allows 15x up and 0.9 down," which is a very different sentence from "15x potential."

Do this in both directions for every position you hold and something useful happens: you stop thinking in price targets and start thinking in ranges. Ranges are how risk actually behaves.

Instructions

How to run a comparison properly: 5 steps

  1. Pick your base and target coin sensibly

    Compare projects in the same league: memecoin to memecoin, exchange token to exchange token, layer one to layer one. Comparing a micro-cap to Bitcoin is an exercise in imagination, not analysis.

  2. Verify circulating supply in two sources

    Open two independent data aggregators and compare the base coin's circulating supply. A difference above a few percent means one of them treats team or foundation tokens differently โ€” read the documentation before you calculate anything further.

  3. Do the division

    Target coin's market cap รท base coin's circulating supply = hypothetical price. Write down the date and your input values too โ€” caps can move by double-digit percentages in a week, and the result ages fast.

  4. Convert to a multiple and confront reality

    Hypothetical price รท current price = the multiple. Now the important question: where would the capital for that valuation come from, and why to this project specifically? No good answer is itself an answer.

  5. Repeat the calculation for future supply

    Check the unlock and emission schedule. Run the sum again using the supply that will actually be circulating in one or two years. If the result halves, you've just met the real price of that "cheap" token.

Price versus market cap: myths and arithmetic

The myth about coin priceWhat market cap arithmetic says
"A $0.001 coin is cheap โ€” I'll buy a million of them"Cheapness is measured by market cap and project valuation, not unit price. A million cheap tokens is still just $1,000 of risk.
"When it hits $1 that's a 1,000x"A 1,000x in price is a 1,000x in market cap (at constant supply). Check whether any project in that sector has such a cap.
"This coin can't go up anymore, it costs $60,000"A high unit price doesn't cap market cap growth โ€” you can buy fractions. Valuations grow, not "units."
"Supply doesn't matter, hype does"Unlocks dilute price on a schedule. Hype doesn't suspend that; at best it postpones it.
"10% of the leader's cap is a modest goal"For the vast majority of projects, 10% of the sector leader's cap is an extreme-optimism scenario, not a base case.
"Two coins at the same price are equally valued"Identical unit prices say nothing. Compare caps: the same $2 price can mean a $200 million project or a $20 billion one.

All numeric values in the examples on this page are illustrative. Features of the official Crypto Bubbles app are attributed to cryptobubbles.net (as of July 2026).

The calculator and the bubble board: a duo, not a rivalry

Worth tying the two tools together at the end. The Crypto Bubbles board โ€” which according to the official cryptobubbles.net site covers more than a thousand coins across several time windows โ€” shows market cap proportions visually: bubble area corresponds to project size, so before you compute anything you can already see that your candidate for "the next Ethereum" has a bubble a few hundred times smaller than Ethereum's. The calculator puts a number on that picture. If this visualization is new to you, a good starting point is our guide to what Crypto Bubbles is, followed by the app download instructions for phone and desktop.

The short version of this page

  • A CoinCompare calculator computes a hypothetical price: coin B's market cap รท coin A's circulating supply.
  • The output is a thought experiment for judging scale โ€” not a price target and not a forecast.
  • Always know which supply you plugged in: circulating, total or max. Unlocks dilute the result.
  • A coin's unit price says nothing about whether it's "cheap" โ€” that's unit bias, the shiller's favorite lever.
  • The healthiest use: run scenarios in both directions, up and down, inside the same sector.

FAQ

Frequently asked questions about the CoinCompare calculator

What does a CoinCompare calculator actually compute?

A hypothetical price: what one unit of coin A would cost if the whole project were valued like project B. The formula is coin B's market cap divided by coin A's circulating supply. It is a thought experiment for judging scale, not a price forecast.

Is the calculator's output a realistic price target?

No. The calculator shows arithmetic only: which price corresponds to a given market cap at today's supply. It says nothing about whether the market will ever supply the capital such a valuation needs, or whether the project deserves it.

Why does a coin's unit price mean nothing on its own?

Because it depends on how many units are in circulation, and that number is arbitrary. A $0.10 coin with a trillion tokens outstanding is valued higher than a $100 coin with a million tokens. Comparing prices without market caps is the classic beginner error, known as unit bias.

Which supply goes into the formula: circulating, total or max?

For a hypothetical price here and now, use circulating supply, because that is what market cap is calculated from. Total and max supply are for assessing future dilution โ€” if a large share of tokens has yet to enter circulation, the result needs to be marked down accordingly.

Does comparing DOGE to Bitcoin's market cap make any sense?

As an arithmetic exercise, yes. As an investment scenario, not really. That comparison requires the market to value a memecoin like the largest and oldest project in the industry. What the calculator shows is exactly that: the size of the assumption hiding behind a slogan like "DOGE to $30".

Does Crypto Bubbles have a built-in comparison calculator?

The official Crypto Bubbles app (cryptobubbles.net) is first of all a bubble-style market visualization; CoinCompare-style market cap comparisons live in data aggregators and standalone calculators. The math is identical everywhere, so you can also do it by hand in about 30 seconds.

Done running scenarios? Time for reality.

Leave hypothetical prices in the spreadsheet. Real quotes, real volume and a real order book live on a regulated exchange โ€” start small and turn on 2FA from day one.